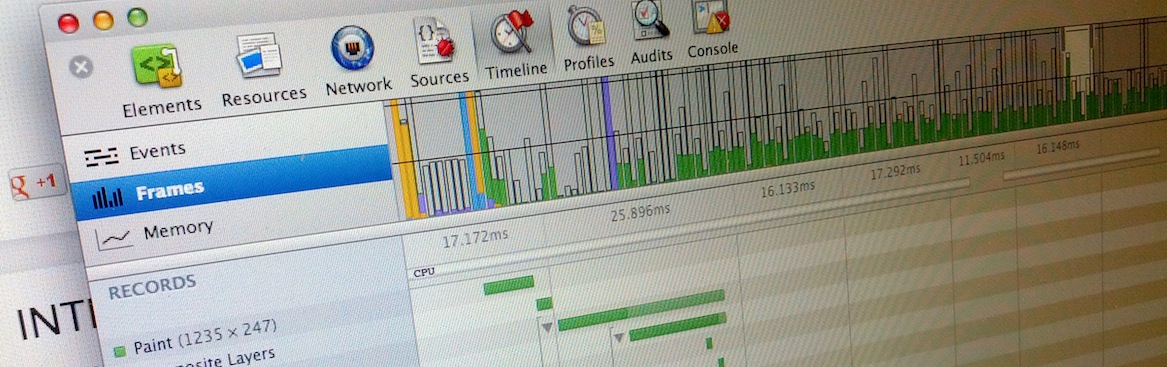
Chrome Remote Debugging Protocol
Created by Vladimir Petriko
Why?
- How dev tool works
- Single page applications
Look here first
https://developers.google.com/chrome-developer-tools/docs/debugger-protocol
Google Chrome Canary
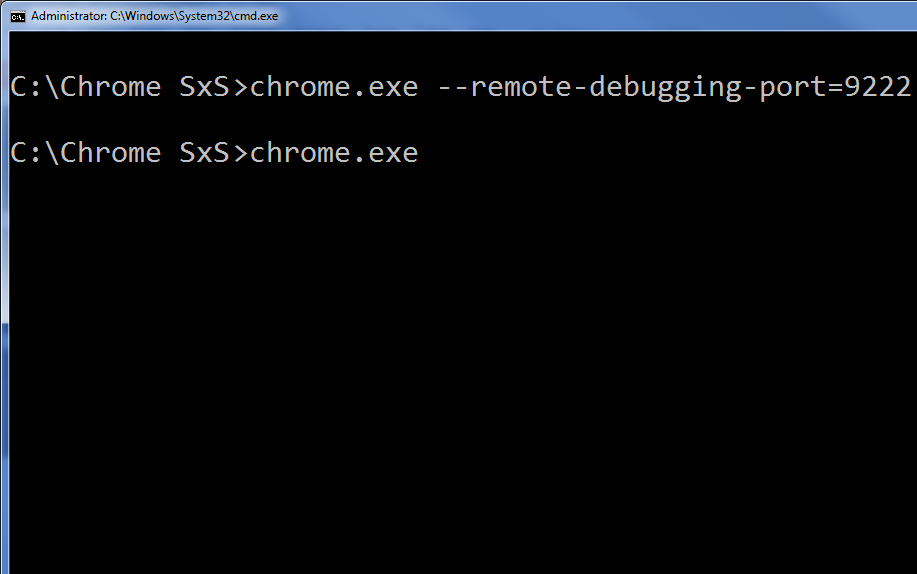
* For presentation launch both Chrome Canary instances with --disable-web-security flag also
Under the hood...
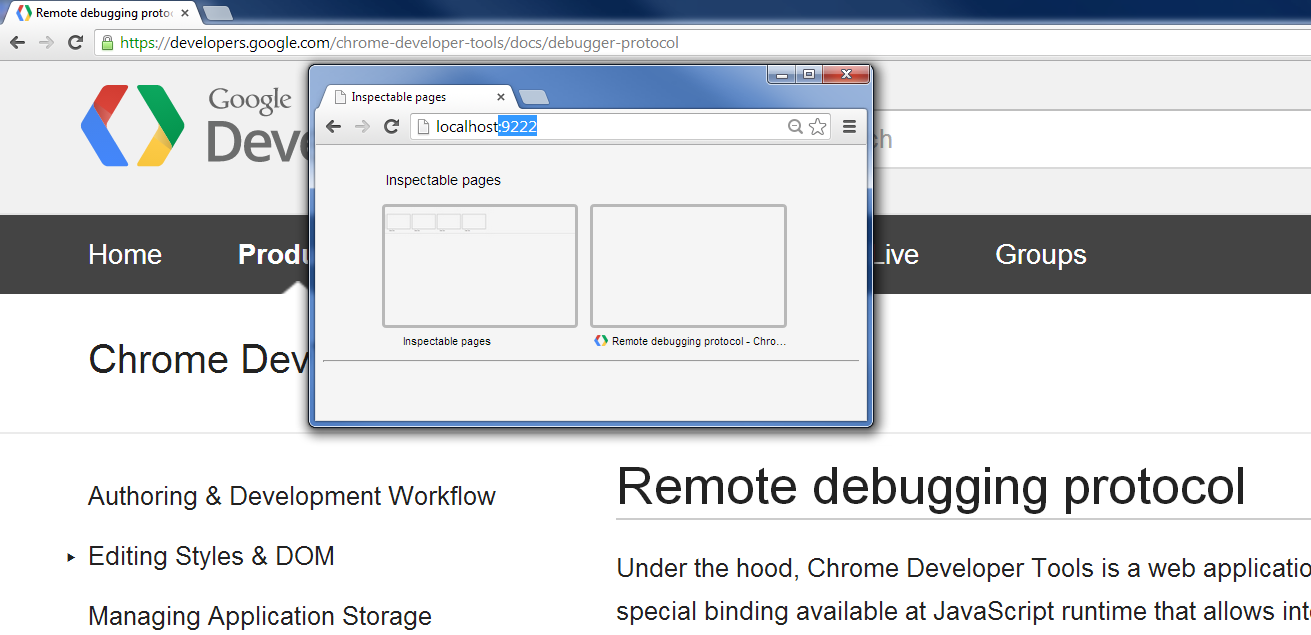
When you navigate your client browser to the remote's Chrome port, Developer Tools front-end is being served from the host Chrome as a Web Application from the Web Server.
...Under the hood
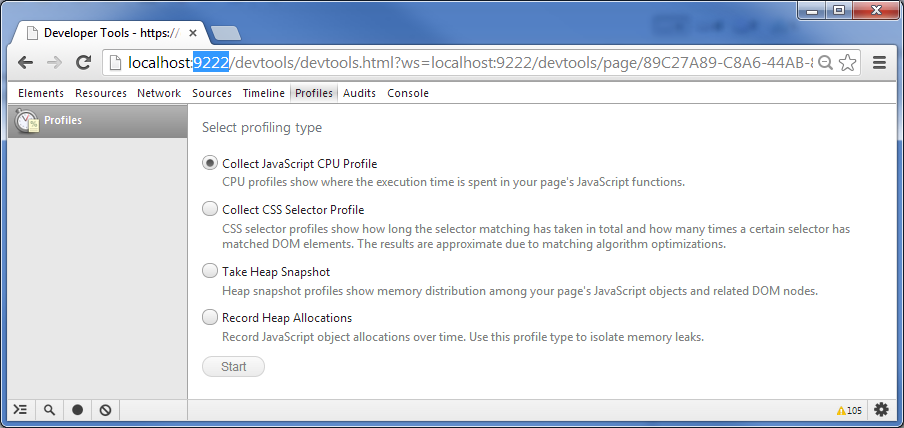
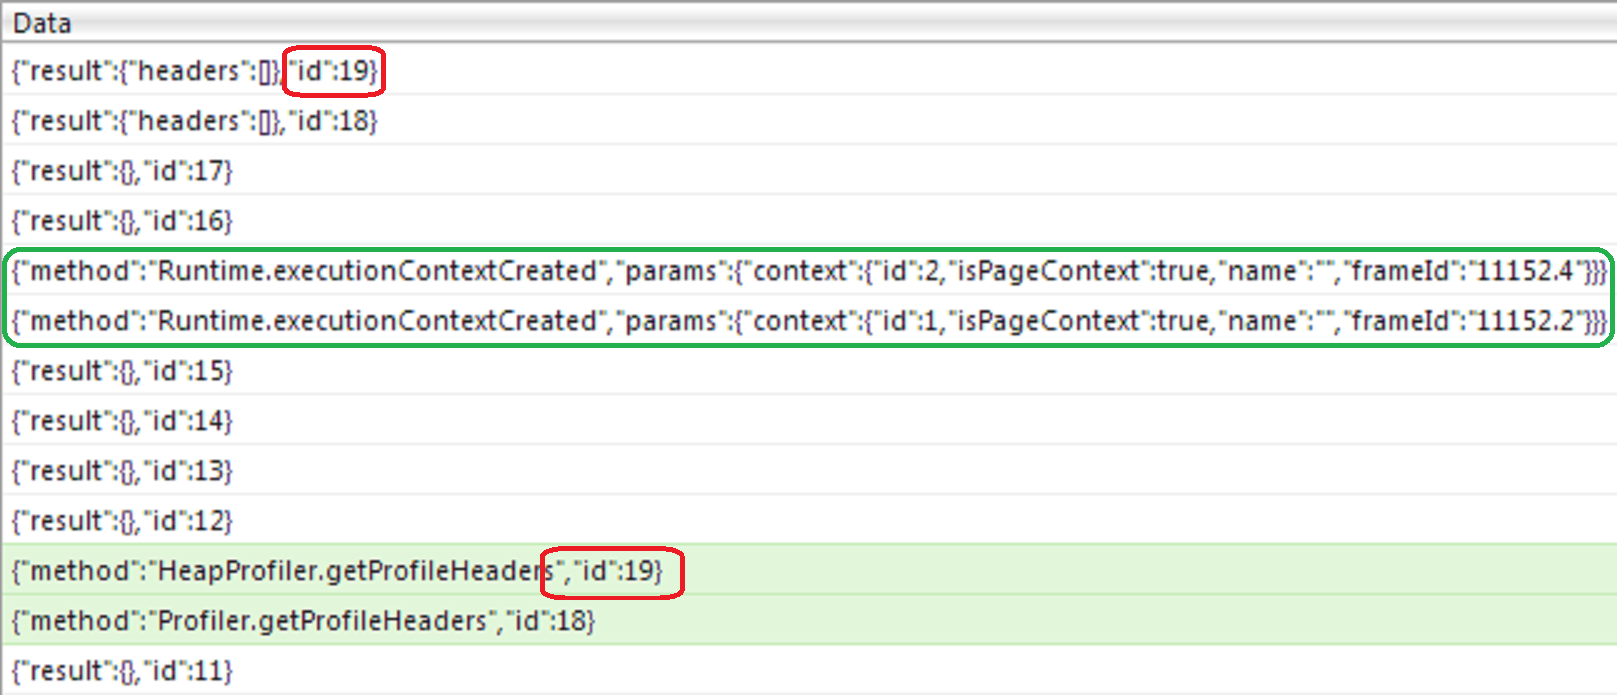
Once loaded, Developer Tools establishes a Web Socket connection to its host and starts interchanging JSON messages with it.

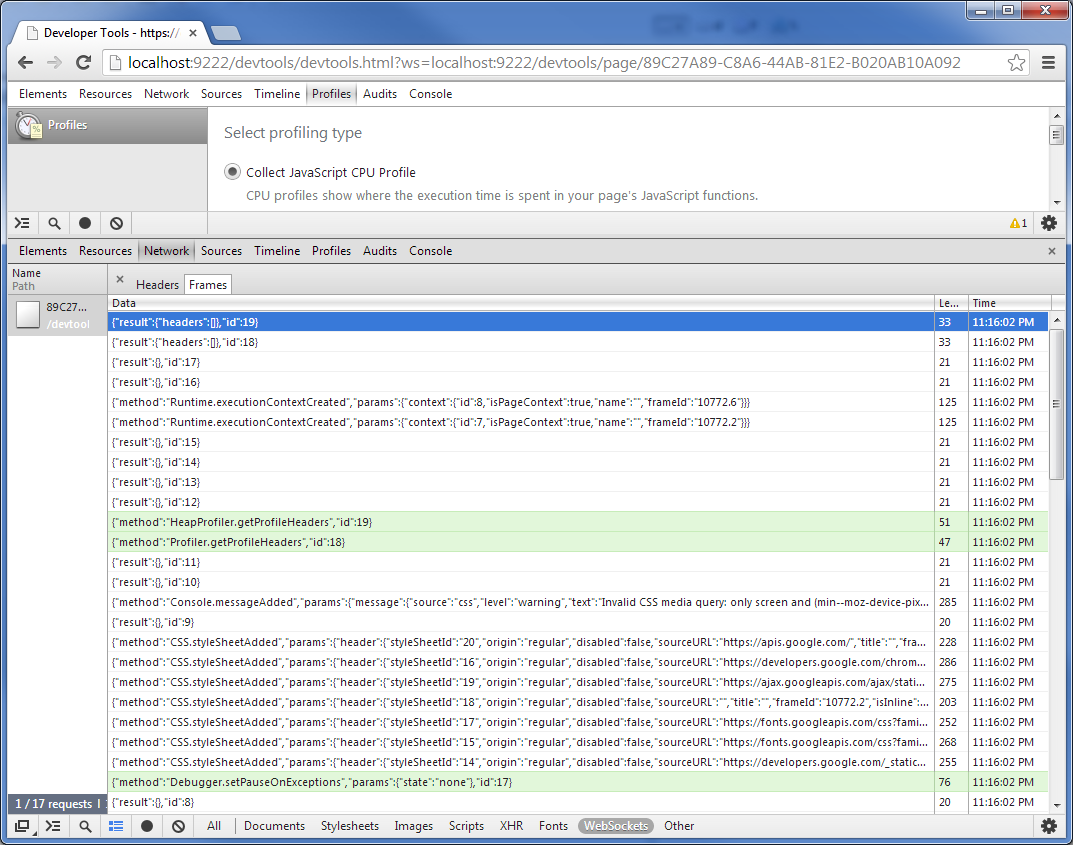
Commands & Events
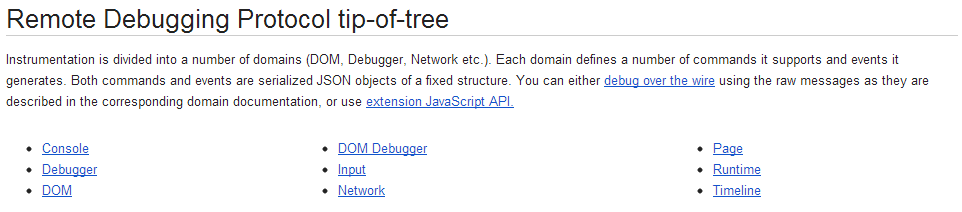
Remote Debugging Protocol tip-of-tree
Debugger extension API
- attach
- detach
- sendCommand
- getTargets
- --------------------
- onEvent
- onDetach
Time to Code!
                        steps.prerequisites()

                             .then(getInspectablePages)

                             .then(getTargetPage)

                             .then(createSocket)

                             .then(setupEventsLogging)

                             .then(initializePageSettings)

                             .then(startProfiler)

                             .then(executeTestAction)

                             .then(takeProfileResults)

                             .then(logResults)
Пыщ!
(Results will be here)
* Open sample/index.html page in your host Chrome Canary browser